Protokol
Table of Contents
At work we run a whole suite of end-to-end tests for every incoming Pull Request. These tests compile our
application, use kind to setup a temporary Kubernetes cluster, install our application plus a bunch of
dependencies (like nginx or cert-manager) and then test our code.
As applications, not just ours at work, are often made up of many different Pods, actively following their
logs with kubectl logs is difficult: kubectl logs supports a label selector, but it’s only evaluated once
when kubectl is run. Newly created Pods will no show up in the output. Additionally using the label
selectors is inflexible and quite limited. I can see why kubectl is “limited”: Doing anything more quickly
becomes inefficient and giving all developers a tool to severely stress the Kubernetes apiserver might not
be a good idea.
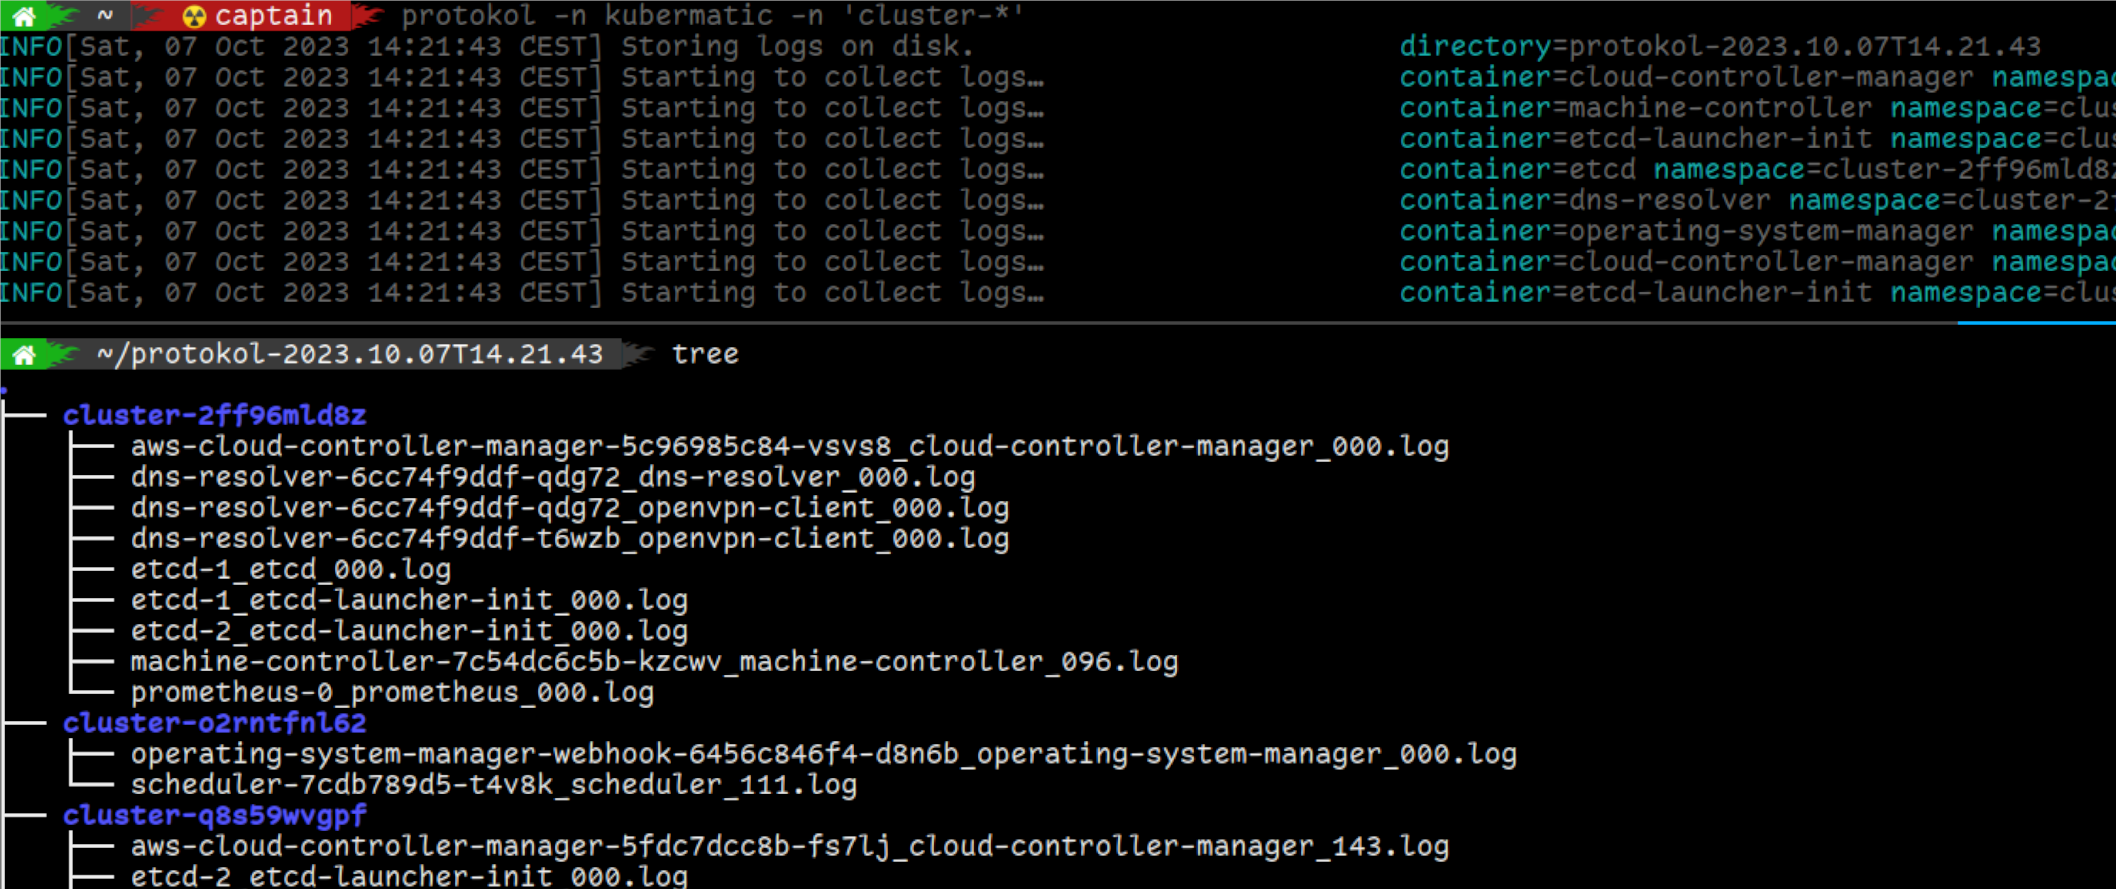
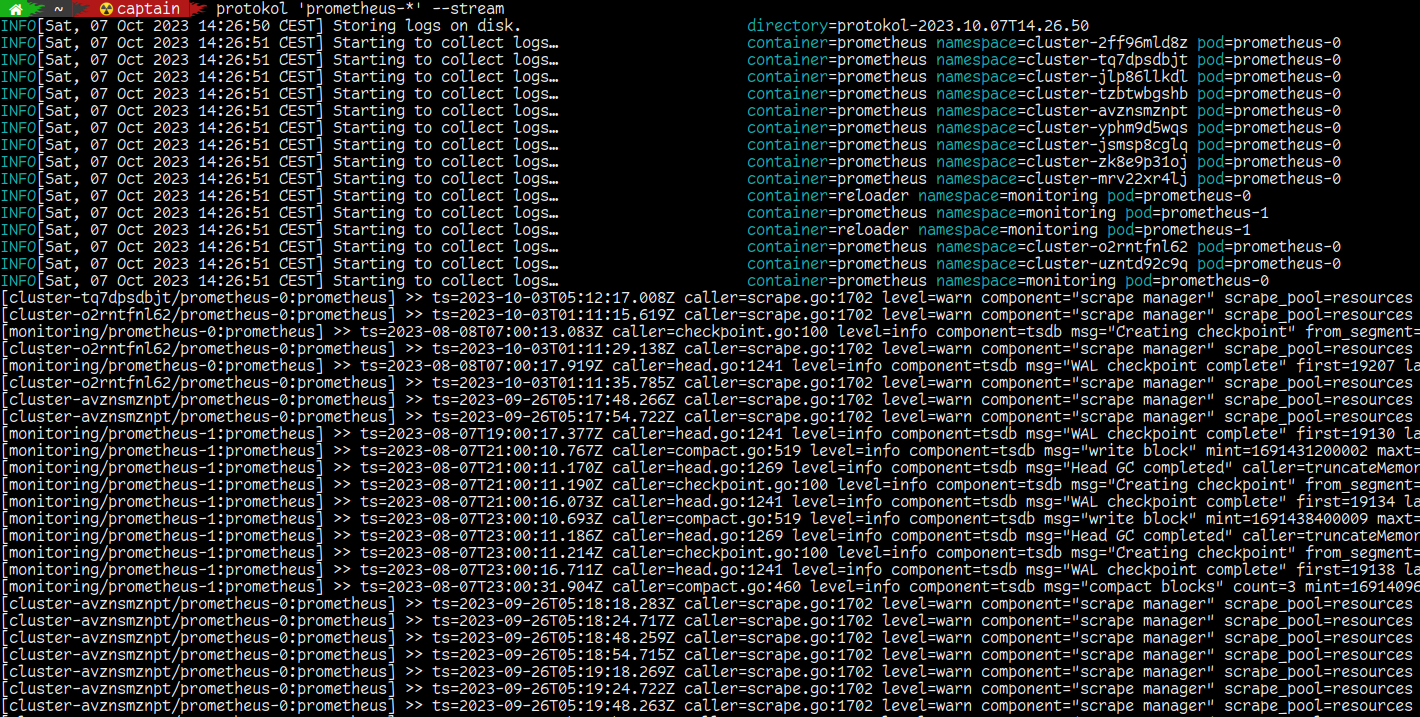
However that doesn’t mean we cannot build ourselves such an application :-) So I developed protokol: Start it once, tell it what namespaces, Pod names or labels you are interested in and it will continue to watch for new Pods that match your filter criteria and then begin to download their logs. Logs are by default written to disk to allow for relaxed inspection after the tests have completed, however more recent protokol versions also allow to stream the logs to stdout.
Caveat: To make all this possible, protokol has to watch all Pods cluster-wide. Depending on the size of your cluster, this will cause quite some load on the control plane. Likewise, tailing the logs for many containers at the same time can also be stressful to your cluster. protokol is a debugging/development aid, not something you should use in production all day long.
Examples
Usage
Instead of showing all flags in use, here’s just a list of them:
$ protokol --help
Usage of protokol:
  -c, --container stringArray   Container names to store logs for (supports glob expression) (can be given multiple times)
      --events                  Dump events for each matching Pod as a human readable log file (note: label selectors are not respected)
      --events-raw              Dump events for each matching Pod as YAML (note: label selectors are not respected)
  -f, --flat                    Do not create directory per namespace, but put all logs in the same directory
      --kubeconfig string       kubeconfig file to use (uses $KUBECONFIG by default)
  -l, --labels string           Label-selector as an alternative to specifying resource names
      --live                    Only consider running pods, ignore completed/failed pods
      --metadata                Dump Pods additionally as YAML (note that this can include secrets in environment variables)
  -n, --namespace stringArray   Kubernetes namespace to watch resources in (supports glob expression) (can be given multiple times)
      --oneshot                 Dump logs, but do not tail the containers (i.e. exit after downloading the current state)
  -o, --output string           Directory where logs should be stored
      --prefix string           Prefix pattern to put at the beginning of each streamed line (pn = Pod name, pN = Pod namespace, c = container name) (default "[%pN/%pn:%c] >>")
      --stream                  Do not just dump logs to disk, but also stream them to stdout
  -v, --verbose                 Enable more verbose output
  -V, --version                 Show version info and exit immediately
Download everything in a namespace
If you want all logs from all containers in a (or multiple) namespaces, just use the -n flag:
$ protokol -n my-namespace -n another-namespace
Download logs from one application in many namespaces
Instead of filtering by namespace name, you can filter by Pod name. If no additional namespace filter is given, protokol will look for matching Pods in all namespaces.
$ protokol 'myapp-*'
Note how glob expressions are supported and make it much easier to quickly find the right Pod, compared to figuring out the appropriate label selector, if there even is one.
Usage in CI jobs
At work we use Prow, which will automatically collect and upload all
files in /artifacts when a CI job has finished. This fits in nicely with protokol and so in our CI scripts we
simply start protokol before the tests begin and let it capture everything that happens:
$ protokol -n kubermatic -n cert-manager -n 'cluster-*' -o /artifacts &